The waiting list for routine treatment has continued to climb, while ambulance response times have lengthened and more people are waiting longer in A&E departments.
Here are the key figures from the latest NHS performance data for England:
– Overall waiting list
The waiting list for routine hospital treatment has reached a new record high, standing at 7.77 million at the end of September, up slightly from 7.75 million in August.


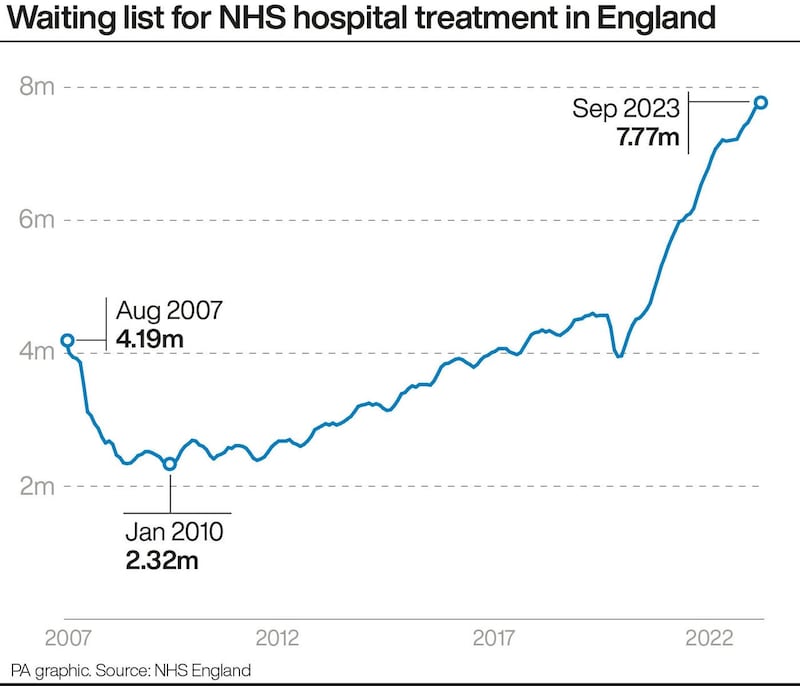
It is the highest number since records began in August 2007.
The list has been growing for much of the last 10 years, passing three million in 2014, four million in 2017, five million in 2021 and seven million in 2022.
In February 2020, the last full month before the start of the Covid-19 pandemic, it stood at 4.57 million.
The figure of 7.77 million for September 2023 refers to the number of incidences of people waiting for hospital procedures or consultations.
NHS England estimates that around 15% of patients are waiting for more than one of these appointments.
The number of individual patients on the waiting list stood at an estimated 6.50 million in September, a record high, up from 6.47 million in August.
– Waits of longer than 18 months
There were 10,201 people waiting more than 18 months to start routine hospital treatment at the end of September, up from 8,998 at the end of August.
The Government and NHS England set the ambition of eliminating all waits of more than 18 months by April this year, excluding exceptionally complex cases or patients who choose to wait longer.
– Waits of more than a year
A total of 391,122 people had been waiting more than 52 weeks to start routine hospital treatment at the end of September, down from 396,643 at the end of August.
The Government and NHS England have set the ambition of eliminating all waits of more than a year by March 2025.
– Cancer referrals
The proportion of patients seen by a cancer specialist within two weeks of being referred urgently by their GP fell from 74.8% in August to 74.0% in September, remaining below the target of 93%.
The 93% figure is one of several cancer targets that are about to be discontinued, as part of an agreement by the Government and NHS England to streamline performance standards.
Some 59.3% of cancer patients who had their first treatment in September after an urgent GP referral had waited less than two months, down from 62.8% in August.
The target is 85% and will remain one of the key cancer measures following the overhaul of performance standards.

Meanwhile, 69.7% of patients urgently referred for suspected cancer were diagnosed or had cancer ruled out within 28 days, down from 71.6% the previous month.
The target is 75% and this will also remain one of the performance standards.
There were 257,702 urgent cancer referrals by GPs in England in September, down 4% on 267,555 in August but up 1% year-on-year from 254,455 in September 2022.
– Cancer diagnostic waiting list
The number of patients in England waiting longer than 62 days since an urgent GP referral for suspected cancer was 24,920 in the week ending October 1, up from 23,809 in the week ending September 3.
The figure was nearly 34,000 at the end of September 2022.
Most of the patients included in this total do not have cancer and are waiting for a diagnostic test, while around one in six do have cancer and are waiting for treatment.
The Government and NHS England set the ambition of returning this figure to pre-pandemic levels by March this year.
The average weekly figure for the pre-pandemic month of February 2020 (covering the four weeks to March 1) was 13,463.
– Accident & emergency waits
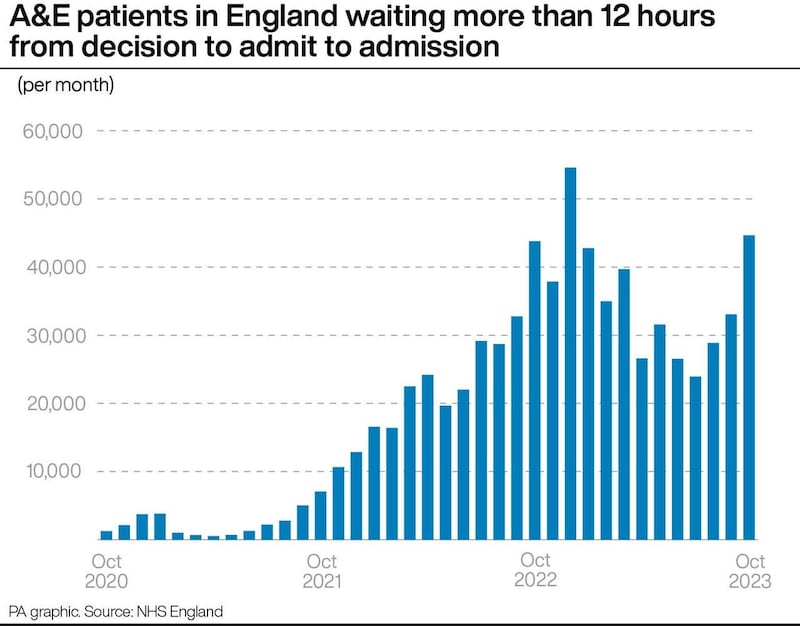
Some 44,655 people had to wait more than 12 hours in A&E departments in England in October from a decision to admit to actually being admitted, up 35% from 33,059 in September.
The figure hit a record 54,573 in December 2022.
The number waiting at least four hours from the decision to admit to admission has also increased, from 125,787 in September to 144,926 in October, a rise of 15%.
Meanwhile, 70.2% of patients were seen within four hours in A&Es last month, down from 71.6% in September.
The figure hit a record low of 65.2% in December 2022.
The NHS recovery plan sets a target of March 2024 for 76% of patients attending A&E to be admitted, transferred or discharged within four hours.
– Ambulance response times
The average response time in October for ambulances in England dealing with the most urgent incidents, defined as calls from people with life-threatening illnesses or injuries, was eight minutes and 40 seconds, NHS figures show.
This is up from eight minutes and 31 seconds in September and is above the target standard response time of seven minutes.
Ambulances took an average of 41 minutes and 40 seconds last month to respond to emergency calls such as heart attacks, strokes and sepsis.
This is up from 37 minutes and 38 seconds in September, while the target is 18 minutes.
Response times for urgent calls, such as late stages of labour, non-severe burns and diabetes, averaged two hours, 31 minutes and five seconds in October, up from two hours, 15 minutes and 59 seconds in September.