The overall waiting list has hit another record high and A&E times have got longer, though ambulance responses have improved.
Here are the key figures from the latest health service performance data for England:
– Overall waiting list
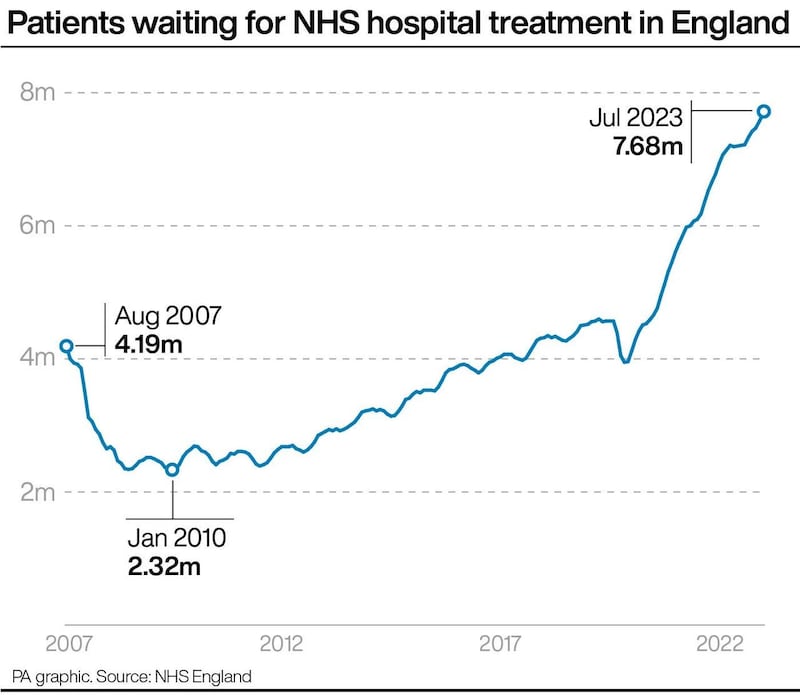
The number of people waiting to start routine hospital treatment has climbed to a new record high.


An estimated 7.68 million people were waiting to start treatment at the end of July, up from 7.57 million in June.
It is the highest number since records began in August 2007.
Prime Minister Rishi Sunak has made cutting waiting lists one of his priorities for 2023, pledging in January that “lists will fall and people will get the care they need more quickly”.
The waiting list has been growing for much of the last 10 years, passing three million in 2014, four million in 2017, five million in 2021 and seven million in 2022.
In February 2020, the last full month before the start of the Covid pandemic, it stood at 4.57 million.
Since then, the list has increased by just over three million, to 7.68 million as of July this year.
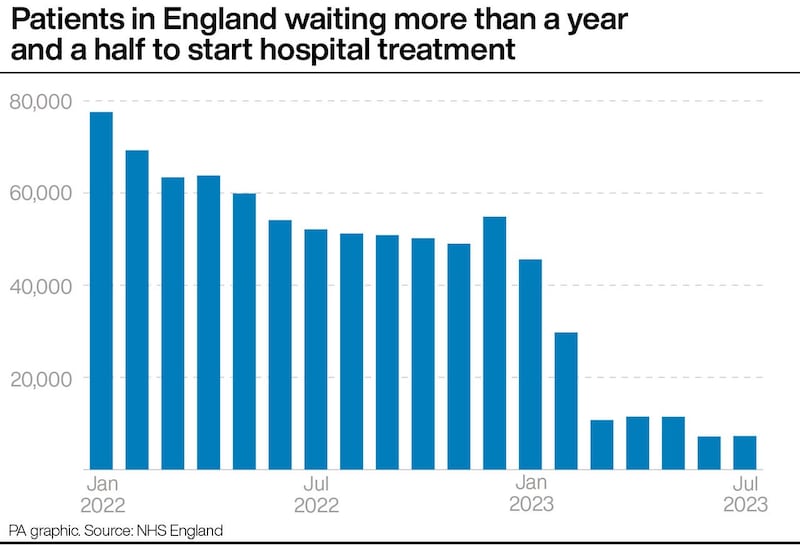
– Waits of longer than 18 months
There were 7,289 people waiting more than 18 months to start routine hospital treatment at the end of July, up from 7,177 at the end of June.
The Government and NHS England set the ambition of eliminating all waits of more than 18 months by April this year, excluding exceptionally complex cases or patients who choose to wait longer.
– Waits of more than a year
A total of 389,952 people had been waiting more than 52 weeks to start routine hospital treatment at the end of July, up from 383,083 at the end of June.
The Government and NHS England have set the ambition of eliminating all waits of more than a year by March 2025.
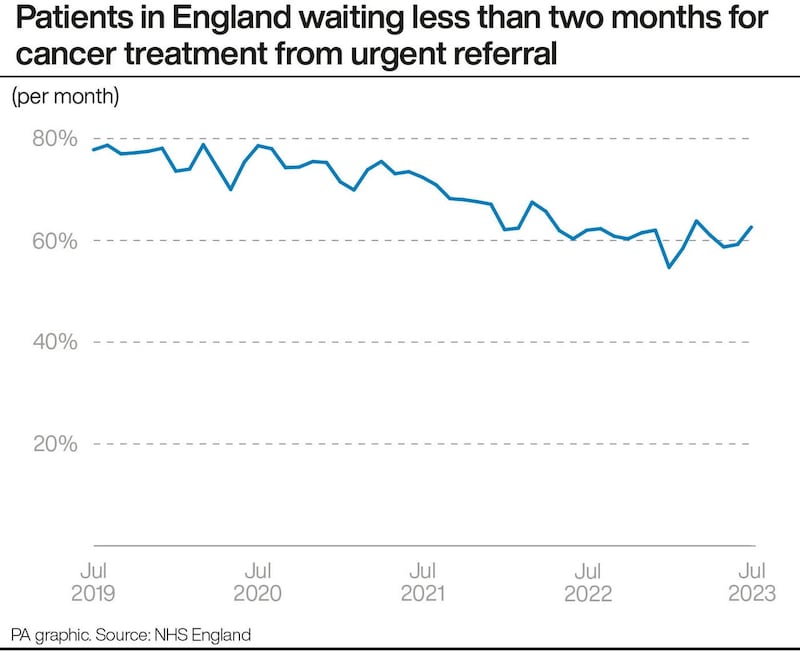
– Cancer referrals
The proportion of patients seen by a cancer specialist within two weeks of being referred urgently by their GP fell from 80.5% in June to 77.5% in July, remaining below the target of 93%.
The 93% figure is one of several cancer targets that are being discontinued from October as part of an agreement between the Government and NHS England to streamline performance standards.
Some 62.6% of cancer patients who had their first treatment in July after an urgent GP referral had waited less than two months, up from 59.2% in June.
The target is 85% and will remain one of the key cancer measures following the overhaul of performance standards in October.
Meanwhile, 74.1% of patients urgently referred for suspected cancer were diagnosed or had cancer ruled out within 28 days in July, up from 73.5% the previous month.
The target is 75% and will also remain one of the performance standards.
There were 263,696 urgent cancer referrals by GPs in England in July, up 1% on 261,006 in June and up 10% year-on-year from 239,739 in July 2022.
– Cancer diagnostic waiting list
The number of patients in England waiting longer than 62 days since an urgent GP referral for suspected cancer stood at 21,118 in the week ending July 30, down slightly from 21,631 in the week ending June 25.
The figure was nearly 34,000 at the end of September 2022.
Most of the patients included in this total do not have cancer and are waiting for a diagnostic test, while around one in six do have cancer and are waiting for treatment.
The Government and NHS England set the ambition of returning this figure to pre-pandemic levels by March this year.
The average weekly figure for February 2020 (covering the four weeks to March 1) was 13,463.
– Accident & Emergency waits
Some 28,859 people had to wait more than 12 hours in A&E departments in England in August from a decision to admit to actually being admitted, up 21% from 23,934 in July.
The figure hit a record 54,573 in December 2022.
The number waiting at least four hours from the decision to admit to admission has also increased, from 109,515 in July to 120,120 in August, a rise of 10%.
Meanwhile, 73.0% of patients were seen within four hours in A&Es last month, down from 74.0% in July.
The figure hit a record low of 65.2% in December 2022.
The NHS recovery plan sets a target of March 2024 for 76% of patients attending A&E to be admitted, transferred or discharged within four hours.
– Ambulance response times
The average response time in August for ambulances in England dealing with the most urgent incidents, defined as calls from people with life-threatening illnesses or injuries, was eight minutes and 17 seconds.
This is down from eight minutes and 21 seconds in July but is above the target standard response time of seven minutes.
Ambulances took an average of 31 minutes and 30 seconds last month to respond to emergency calls such as heart attacks, strokes and sepsis.
This is down from 31 minutes and 50 seconds in July, while the target is 18 minutes.
Response times for urgent calls, such as late stages of labour, non-severe burns and diabetes, averaged one hour, 45 minutes and 27 seconds in August, down from one hour, 50 minutes and nine seconds in July.