THE rise in the cost of living eased somewhat in January, and by more than experts had expected, hinting at a sliver of good news amid the UK's ongoing economic problems.
Data from the Office for National Statistics (ONS) revealed that Consumer Prices Index (CPI) inflation dropped from 10.5 per cent in December to 10.1 per cent last month.
But this inflation was driven more by some items than others.
The cost of low-fat milk, for instance, rose by more than any other category in the 12 months to January.

It contributed towards food being one of the areas where prices had risen by the most, the ONS showed.
Meanwhile, there were a few areas where prices had decreased, such as second-hand cars and personal computers.
The figures are based on the CPI measure of inflation and have been published by the ONS.
In each case, the figure is the percentage change in the average price over the 12 months to January 2023.
Here are some examples of how the cost of everyday items have increased in the past year, along with some of the key decreases:
INCREASES
- Low-fat milk 45.2%
- Olive oil 44.6%
- Sugar 40.9%
- Whole milk 37.2%
- Cheese and curd 35.2%
- Eggs 28.8%
- Motor vehicle insurance 28%
- Butter 27.1%
- Mineral or spring waters 22%
- Ready-made meals 21.9%
- Jams, marmalades and honey 21.4%
- Pasta products and couscous 20.8%
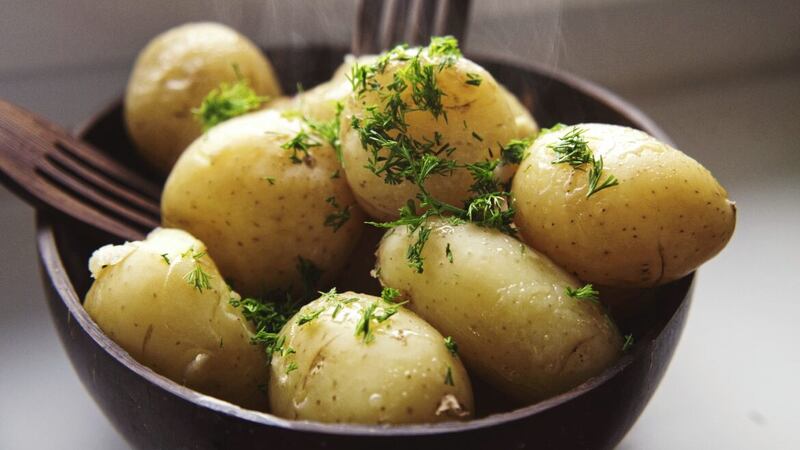
- Potatoes 20.3%
- Fresh or chilled fish 19.6%
- Bread 19%
- Passenger transport by air 18.4%
- Hotels and similar accommodation 18.2%
- Yoghurt 18.1%
- Margarine and other vegetable fats 17.7%
- Footwear for infants and children 17%
- Soft drinks 16.2%
- Refrigerators, freezers and fridge-freezers 15.6%
- Meat 15%
- Crisps 14.7%
- Coffee 14.5%
- Tea 13.5%
- Travel insurance 13%
- Fast food and takeaway food 12.1%
- Household furniture 11.4%
- Rice 11.2%
- Fruit and vegetable juices 10.3%
- Breakfast cereals 9.1%
- Chocolate 8.5%
- Clothes washing machines, clothes drying machines and dishwashing machines 7.4%
- Gardens, plants and flowers 7.2%
- New cars 6.7%
- Fresh or chilled fruit 6.3%
- Plants and flowers 5.8%
- Dental services 4.9%
- Footwear for men 3.8%
- Petrol 3%
- Dried fruit and nuts 2.7%
- Footwear for women 1.1%
- Cinemas, theatres, concerts 0.6%
DECREASES
- Equipment for camping and open-air recreation -1.2%
- Furnishings fabrics and curtains -1.3%
- Charges by banks and post offices -1.3%
- Software -2.7%
- Coffee machines, tea makers and similar appliances -4.6%
- Second-hand cars -7.2%
- Personal computers -7.6%
- Mobile telephone equipment -8%